30-second summary:
- The research shows most agencies failed when it comes to the performance of their website.
- Search engine ranking is a multi-factor game, and performance, while it matters for many reasons, is just one piece in this puzzle.
- Nebojsa Radakovic shares insights.
Ever since Google announced that page speed would be a ranking factor in its mobile-first index in 2018, the need for speed became one of the most important aspects of web dev trait. A lot of businesses jumped onto the speed train.
Sure enough, one year later, Google reported that sites are faster, and abandonment rates are down since making page speed a ranking factor.
With performance being one of the top-selling points of a modern-day web dev architecture Jamstack that we are so into, it was only natural to take a deep dive into the industries that tackle website performance and see how we stand against our peers.
TL;DR: Key findings
Don’t have the time to read through the research? Here are the key findings:
- 27% of websites from our 20K sample still run on HTTP
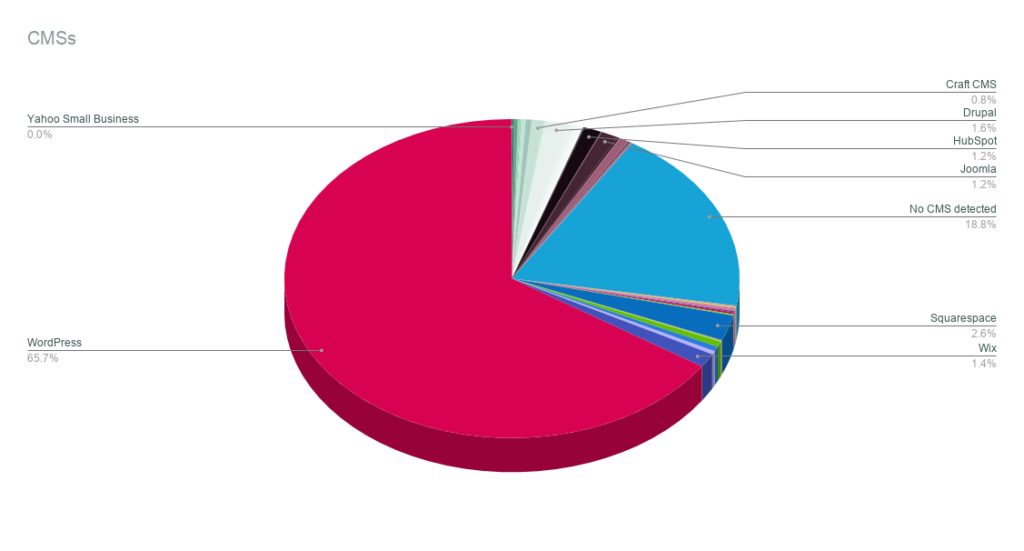
- 65.7% of the websites are built with WordPress
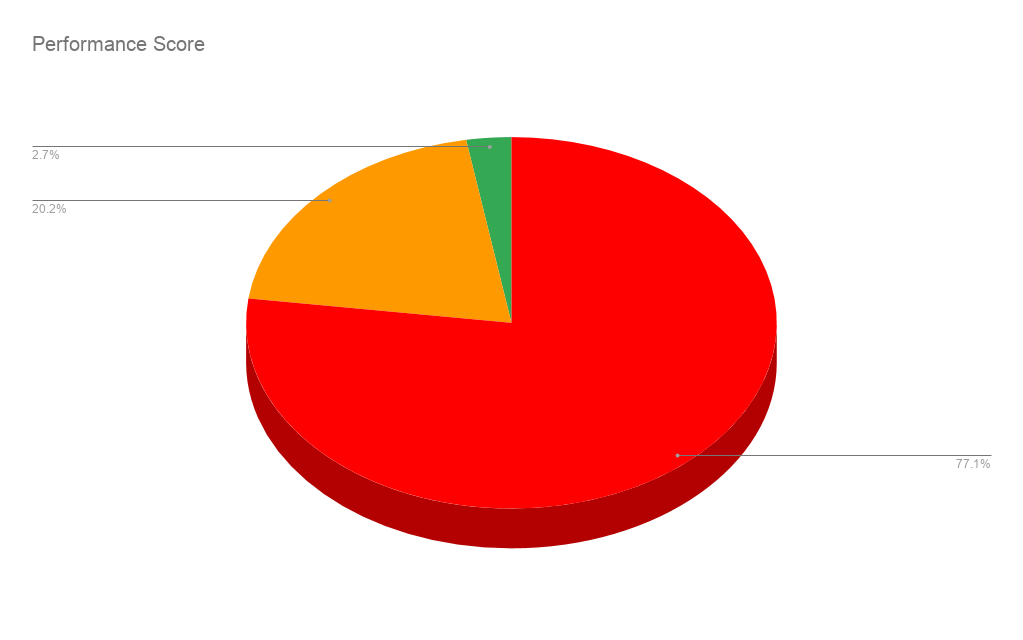
- Only 2.7% of websites have good performance scores
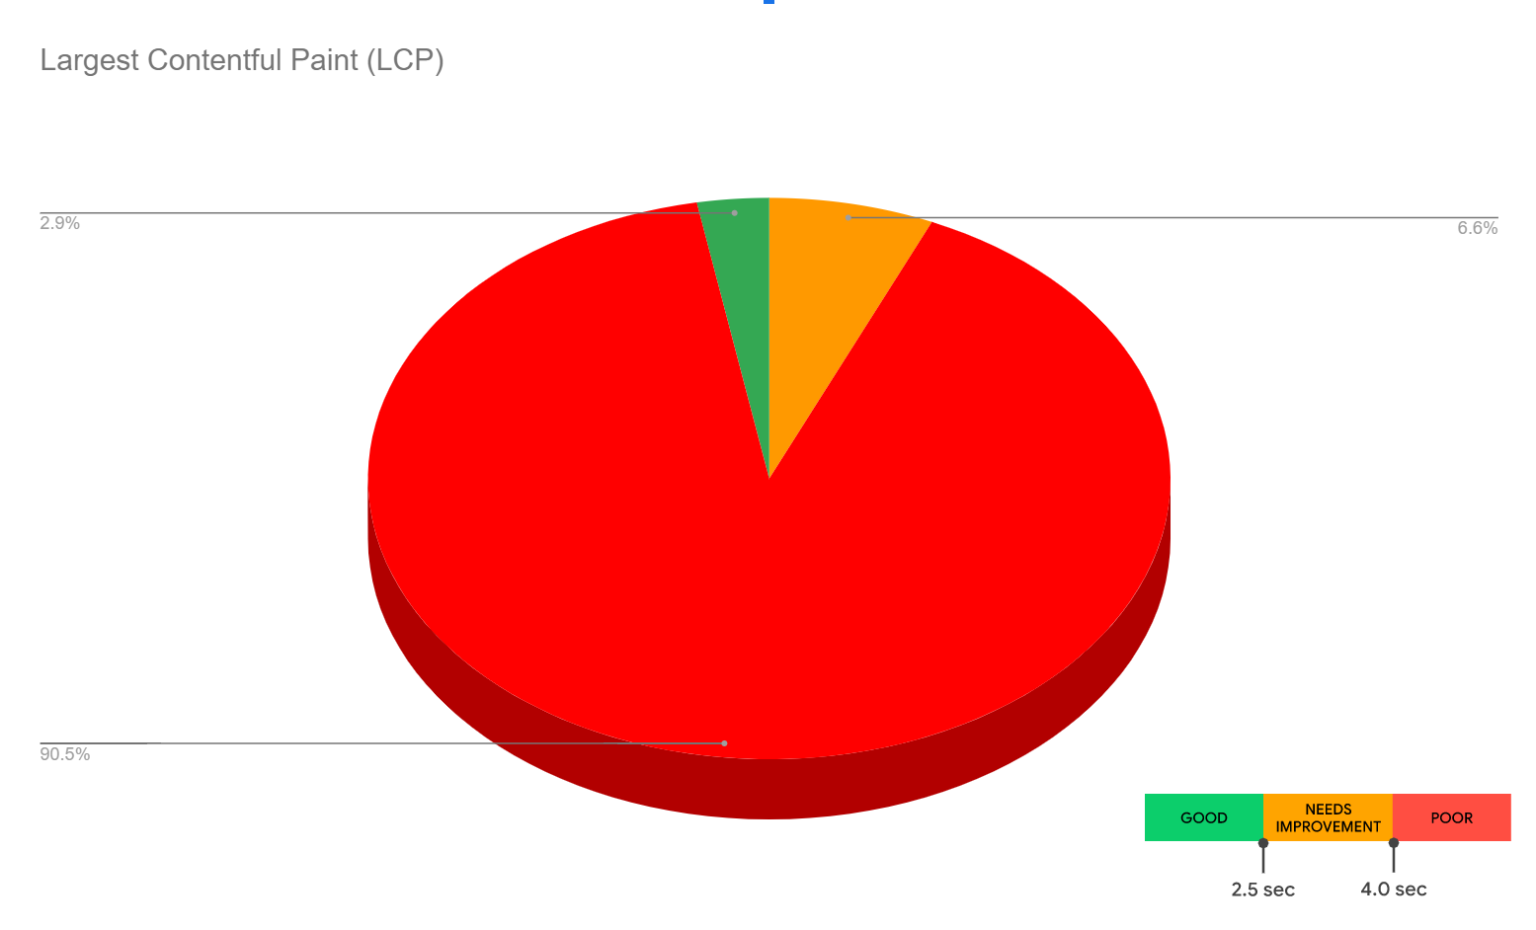
- 2.9% of websites provide good user experience to their users, ie Largest Contentful Paint (LCP) occurs within 2.5 seconds of when the page first starts loading
What data was I interested in, and why?
Lighthouse performance metrics. There are a couple of popular speed testing tools, but most people use Lighthouse. While it may not be perfect because it provides a mix of both lab and field data about a page, I’ve used Pagespeed Insights API as described in James McNulty UpBuild post here, although updated to show core web vitals.
CMS. WordPress or not. 37% of all websites are powered by WordPress. Being the most popular web dev solution, it would be interesting to see and compare different solutions in terms of speed and performance.
Where did I get my URLs from?
Gathering URLs is a time-consuming work. But I managed to get 20k URLs (20397 URLs to be exact). I’ve cross-referenced results I got from scraping the first-page organic results of a set of keywords (like SEO agency, web dev agency, etc.), results I got by using tools such as Phantombuster to scrap review websites, and results I got from hiring virtual assistants on Upwork and Fiver.
There are a couple of issues I had to take care of first. Amazingly 27% of websites from my 20K sample still run on HTTP. That’s not good at all. On top of that, I had a bunch of URLs coming up with NET::ERR_CERT_DATE_INVALID error message in Chrome. Once those were taken care of, I ended up having results 13945 URLs instead of 20K.
The data

Of course, the most popular CMS is WordPress, with 65.7% of websites from my sample using it. For 18.8%, I was not able to detect any CMS. 2.58% run on Squarespace, 1.6% are built with Drupal, 1.41% are on Wix, and so on.
The results should not come as a surprise given that WordPress powers 37% of all the websites on the Internet or 63.6% of all the websites with known CMS.
Performance scores – How scores are color-coded by Google
The metrics scores and the perf score are colored according to these ranges:
- 0 to 49 (Red): Poor
- 50 to 89 (Orange): Needs Improvement
- 90 to 100 (Green): Good
You can read more about it here.
As far as the performance scores for all websites are concerned, 77.1% of the websites are in the poor range, which means there is a lot of room for improvement.

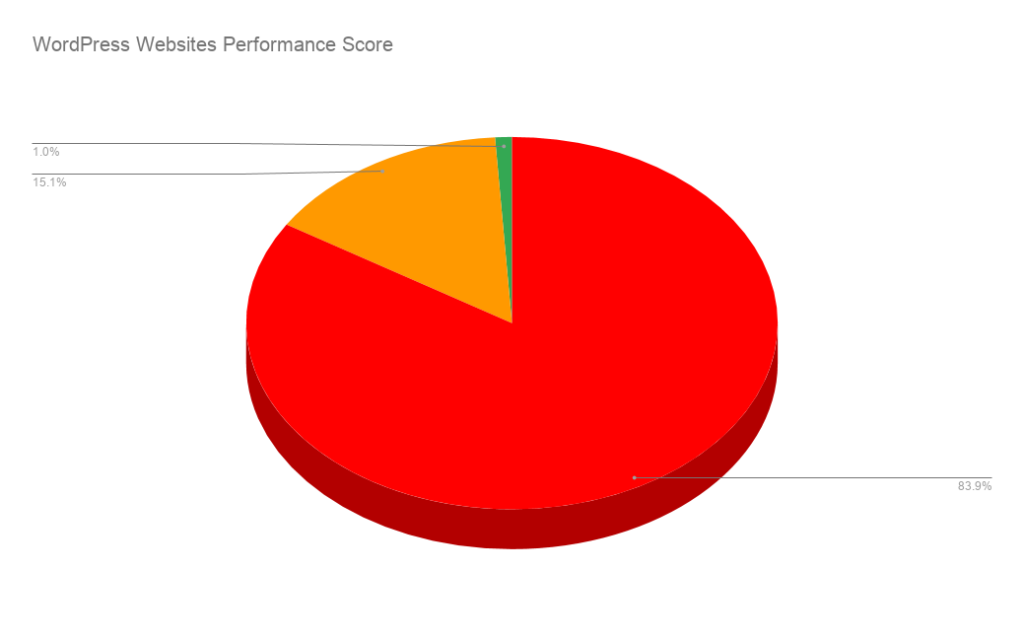
Pretty much the same story when we check only WordPress websites, 83.9% are in the poor performance range.

Core Web Vitals
By now, you probably are well aware of Core Web Vitals. Their importance is twofold:
- Google considers them essential in a webpage’s overall user experience, and understanding them can help you improve the quality of experience you are delivering to your users,
- Google plans to make a page experience an official Google ranking factor with Core Web Vitals being an essential part of it.
The current set for Core Web Vitals focuses on three aspects of the user experience: loading (described with Largest Contentful Paint (LCP) metric), interactivity (described with First Input Delay (FID) metric), and visual stability (described with Cumulative Layout Shift (CLS) metric).
For this research, numbers follow the performance scores. For example, check out the Largest Contentful Paint (LCP) results.

Conclusion
Being that I’ve tested only 20k URLs (actually 13945), let’s not generalize conclusions. However, the general ‘feel’ is that the ones required to think of speed and performance failed the test.
Performance, while it matters for many reasons, is not and should not be the end goal. It depends not only on the tech used but also ‘features’ you’ll have on a website, which pretty much depends on the industry/theme your website is in. And balancing performance and functionality successfully depends on the value a feature brings to your business versus the reduction in speed that results.
The thing is, whatever tech you use, you can end up with good scores (some easier than others). The real question is, how important are the scores for your client, their business, and their audience?
Nebojsa Radakovic is an SEO wiz with 20 years of experience. He is also an extreme sports enthusiast. He can be found on Twitter @CookieDuster_N.
The post Speed and performance of Web dev, SEO, and marketing agencies websites appeared first on Search Engine Watch.

